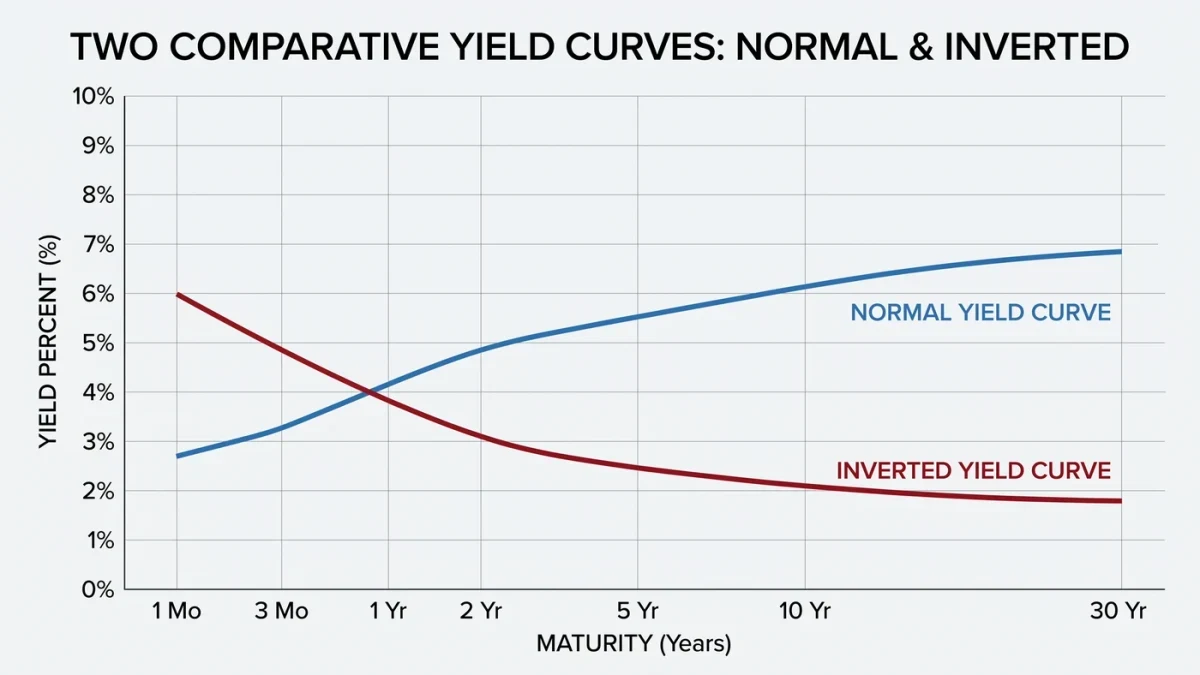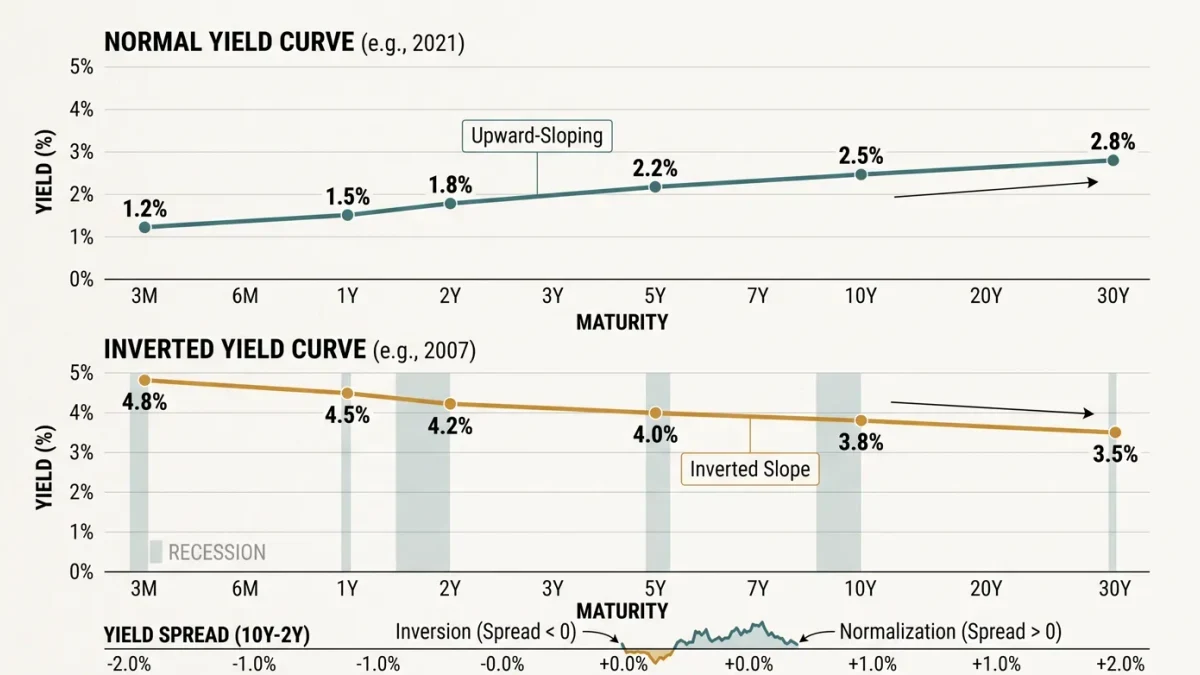
The Treasury yield curve plots the interest rates on government bonds from three months out to thirty years. Normally it slopes upward — lending longer means more risk, so 10-year notes yield more than 3-month bills. When short rates rise above long rates, the curve inverts, and that inversion has preceded every U.S. recession since the 1960s except one, per the Federal Reserve Bank of New York's recession-probability model built from the curve. The gap between then and recession averages under a year, but the range is wide — inversions in the 2019 and 2022 cycles preceded downturns by months to over two years, and the 2022–2024 inversion resolved before the labor market materially broke.
Why would an inversion predict anything?
The mechanism runs through expectations and bank economics. Long rates are the market's average of expected future short rates: if traders expect the Fed to cut sharply — which it does in recessions — the 10-year falls below the current policy rate, inverting the curve. The banking channel is mechanical: banks borrow short, lend long, and an inversion compresses net interest margins, tightening credit supply on its own. When both channels align — markets pricing cuts and banks pulling back — the curve is less a prophecy than a summary of conditions already in motion: restrictive policy, softening credit, and expected easing.
Which spread should you watch?
Economists favor the 10-year minus 3-month Treasury spread — the series the New York Fed's model uses — over the more-quoted 10-year minus 2-year, which has given somewhat noisier signals historically. Recession probability models translate the spread into a 12-month probability; readings above roughly 30 percent have historically flagged danger zones. Depth and duration matter too: a brief shallow inversion is a weaker signal than a deep one sustained for months. The curve is best read with companions — credit spreads, jobless claims, the Sahm rule that identifies recessions from the unemployment rate's three-month average rising half a point — because no single series catches every regime.
- 10y–3m spread: the model standard, cleanest historical record.
- 10y–2y spread: media favorite, noisier.
- Companions: credit spreads, claims, the Sahm rule.
When does the curve fail?
Two documented failure modes. Structural: massive central-bank bond buying — quantitative easing — depresses long yields and can invert or flatten the curve without any recession signal content, a critique applied to the 2019 episode. Lags: the signal is directionally reliable but timing-poor — markets that trade the inversion have repeatedly front-run recessions that arrived much later, or paused mid-course, as in the mid-1990s soft landing when the curve flirted with inversion and the expansion continued. The current cycle's lesson is humility: after the longest inversion in postwar history ended in 2024, the economy slowed without a declared recession, and forecasters still argue about whether the lag ran out or the signal was QE-distorted.
What is the curve saying in 2026?
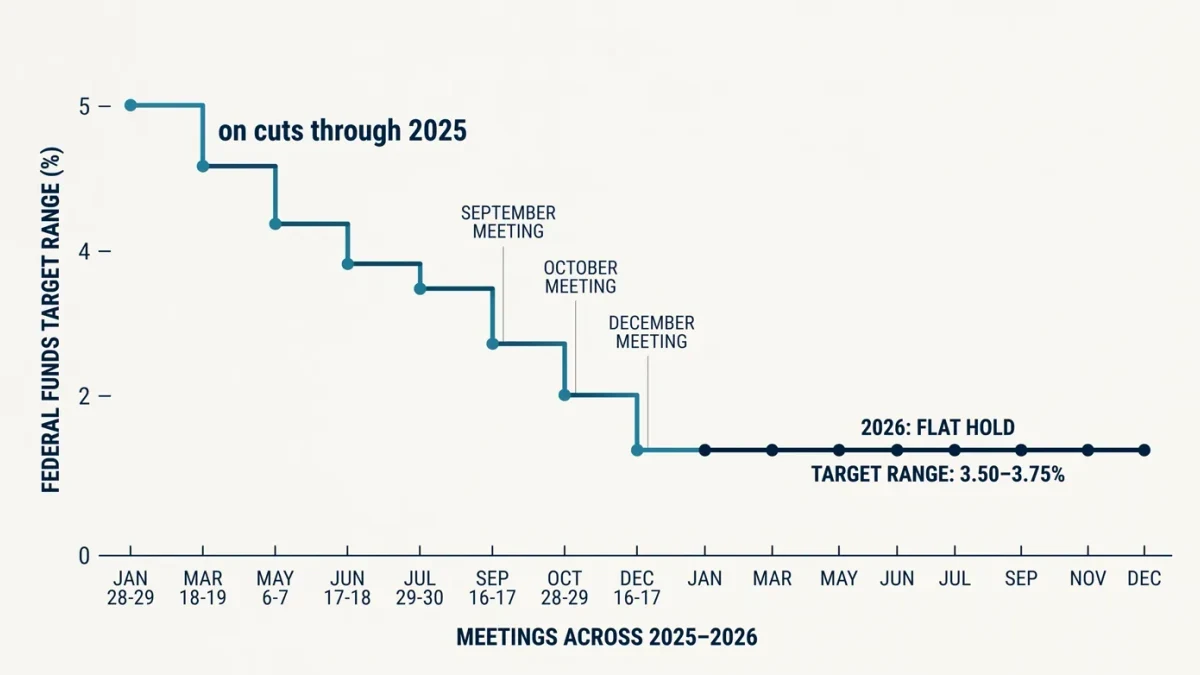
With the Fed holding its target range at 3.50 to 3.75 percent through mid-2026 while longer yields price a shallow easing path, the curve has traded between flat and modestly positive — the classic late-cycle shape that tells you markets expect neither a boom nor a break. The information is real but bounded: the curve prices expectations, and expectations are data, not destiny.
LMH News publishes information, not investment advice. Data described follow Federal Reserve and Treasury market series as of June 2026.