The monthly jobs report — the Employment Situation summary the Bureau of Labor Statistics releases on the first Friday of most months at 8:30 a.m. Eastern — reports how many jobs U.S. employers added, what the unemployment rate did, and how fast wages grew. The report covers two separate surveys: a payroll survey of about 119,000 businesses and government agencies, and a household survey of about 60,000 families that produces the unemployment rate. Economists and the Federal Reserve read them together because they measure different things and can move in opposite directions.
What do payroll numbers actually count?
The headline nonfarm payrolls figure is the net change in jobs on employer payrolls during the survey's reference week — generally the week including the 12th of the month. In 2025, monthly payroll growth averaged under 100,000 for much of the year, per BLS historical tables, a pace economists consider roughly consistent with a labor market cooling toward population growth. Net means hires minus separations: an economy can shed manufacturing jobs and add health-care jobs at the same time, and the payroll number alone will not tell you which. That is why the report's industry detail — health care, government, leisure and hospitality have been the persistent adders since 2024 — matters as much as the top line.
Why can payrolls and unemployment disagree?
Because they come from different surveys with different frames. The payroll survey counts jobs; the household survey counts people. A worker with two jobs appears twice in payrolls and once in the household data. The unemployment rate counts only people who actively looked for work in the past four weeks — when discouraged workers stop searching, they leave the labor force and the rate can fall for the wrong reason. The participation rate, the share of the population working or looking, tells you which force is driving the move.
- Nonfarm payrolls: net jobs added, from employers.
- Unemployment rate: share of the labor force actively seeking work, from households.
- Labor force participation: whether the labor force itself is growing or shrinking.
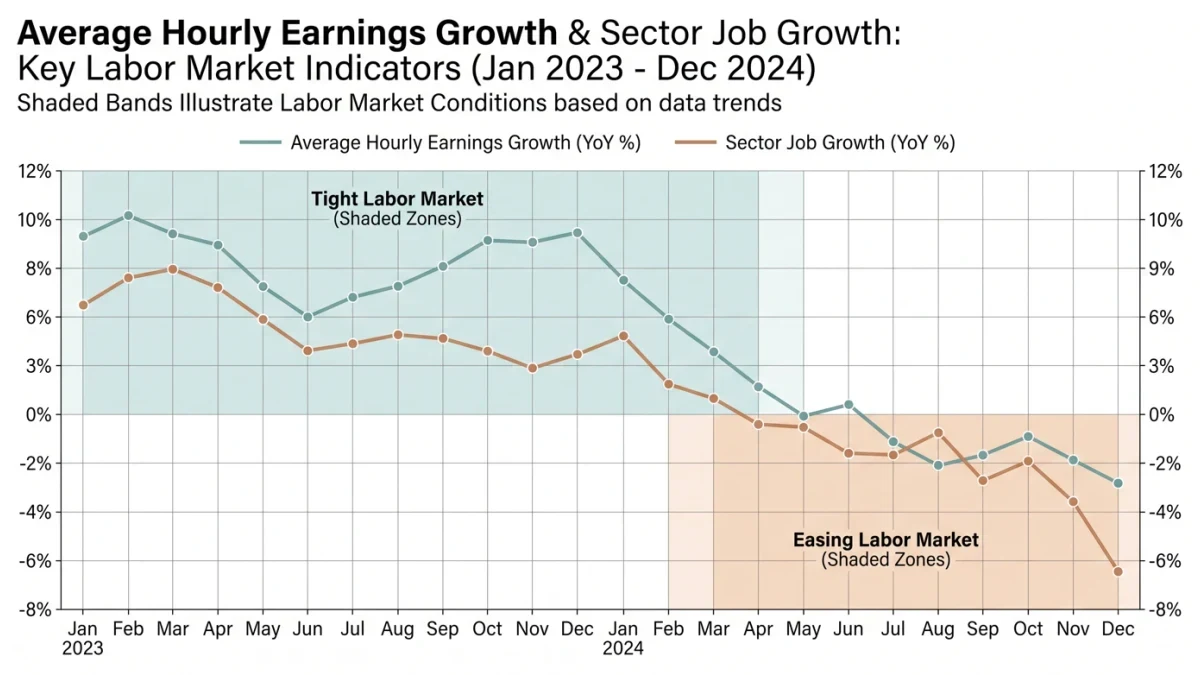
- Average hourly earnings: wage growth, annualized; watched closely for inflation signals.
- Revisions: the two prior months are updated with fresher survey responses — revisions frequently change the story.
What are revisions and why do they matter?
First prints are preliminary. Each release revises the two preceding months, and annual benchmark revisions recalibrate the whole series against unemployment-insurance tax records covering nearly all U.S. employers. The benchmark process has swung cumulative job growth by hundreds of thousands — the 2025 benchmark, published in preliminary form in September 2025, pointed down substantially from first prints, per BLS. A single strong or weak month that reverses on revision was noise; three months of direction is signal.
What does the report mean for interest rates?
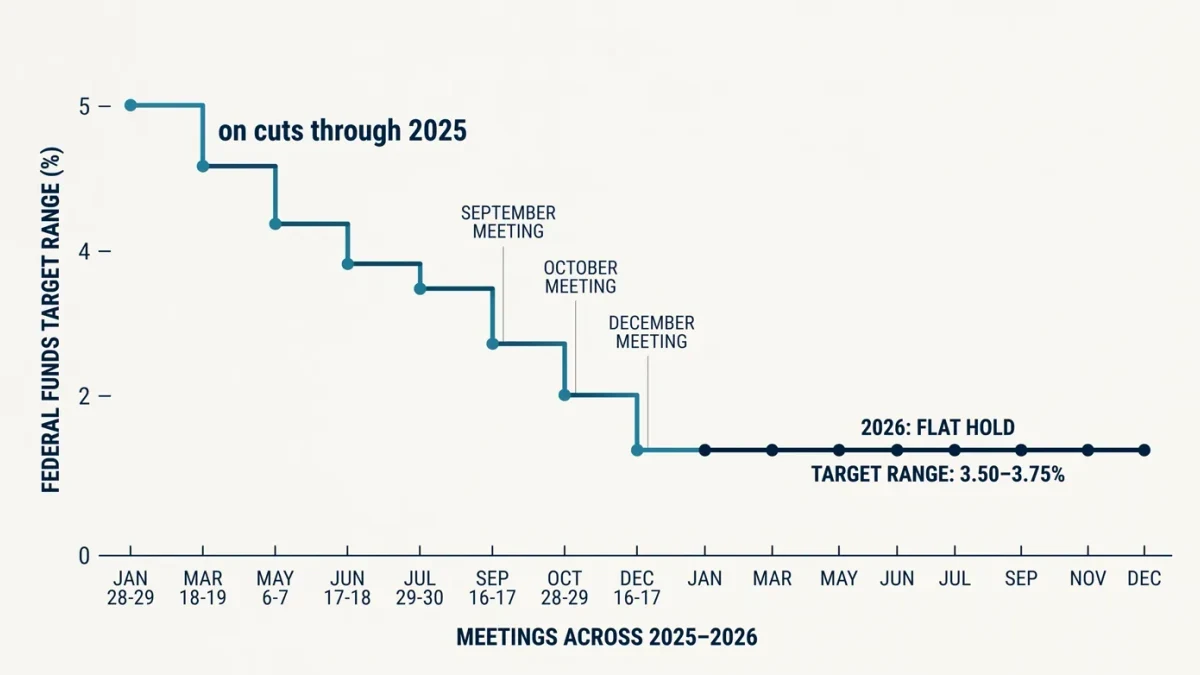
The Federal Reserve holds a statutory mandate for maximum employment and stable prices, and the jobs report is the single most-watched input between Federal Open Market Committee meetings, which in 2026 are scheduled through September 15–16, October 27–28, and December 8–9, per the Fed's published calendar. Weak payroll growth with flat wages raises the odds of rate cuts; hot wage growth alongside low unemployment stiffens the Fed's inflation concern. Through the first half of 2026 the committee held its target range at 3.50 to 3.75 percent while weighing exactly this balance, per its July 29, 2026 statement.
LMH News publishes information, not investment advice. Data described reflect Bureau of Labor Statistics methodology as of January 2026.