Deficit and debt get used as if they mean the same thing. They do not. One measures a gap over a period of time. The other measures a total at a point in time. The difference is simple, and it changes how almost every fiscal debate should be read.
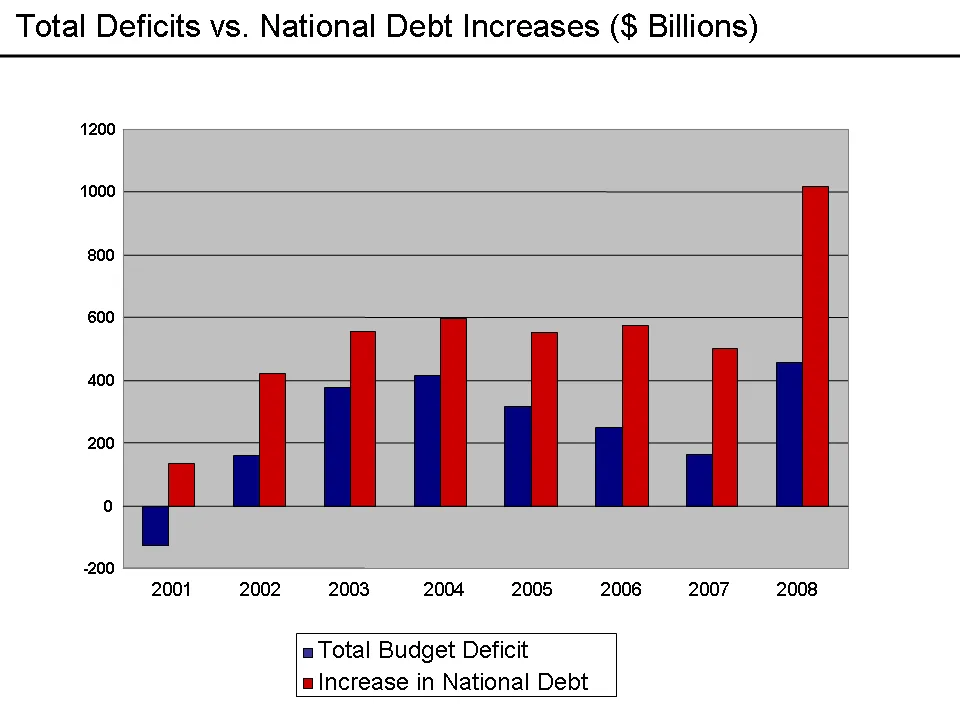
The easiest way to keep them apart is the bathtub image. The deficit is the water flowing in each year. The debt is the level of water in the tub. A year of small inflow still adds to the level. Even a shrinking deficit keeps the debt growing.
A Deficit Is a Yearly Gap
The government budget balance is the difference between government revenues and spending in a given period. A positive balance is a surplus. A negative balance is a deficit. Because it is an amount per unit of time, usually per year, economists call it a flow variable. A budget presents proposed revenues and spending for a financial year, so the deficit is a result of that year's choices plus the state of the economy.
Debt Is the Running Total
Government debt is the total of what a government owes. It is a stock variable, measured at a specific point in time. Gross government debt includes what is owed to domestic residents and, when held by foreign residents, it forms part of the country's external debt. Under cash accounting, the cumulative flow of past deficits equals the stock of debt. The two numbers are linked, but they answer different questions: one describes this year's gap, the other the whole pile.
Why Each Is Measured Against the Economy
A raw dollar figure says little on its own, because countries differ in size. That is why both terms get compared to gross domestic product. A debt-to-GDP ratio shows the debt burden relative to the value of goods and services the economy produces in a year. The OECD treats the general government debt-to-GDP ratio as a key indicator of fiscal sustainability. Deficits are also often discussed as a share of GDP, which puts one country's yearly gap next to another's on a fair scale. For related coverage, see Valladares Says $10 Million in State Budget Projects Headed to District 23.
What the Numbers Have Shown
The scale of government debt grew sharply in recent decades. In 2020, the value of government debt worldwide reached US$87.4 trillion, or 99 percent of global GDP, according to the Wikipedia summary of the data. Government debt accounted for almost 40 percent of all debt, the highest share since the 1960s. The rise since 2007 is largely attributed to stimulus measures during the Great Recession and the COVID-19 recession. Borrowing in a shock can act as an economic shock absorber, keeping services running when tax revenue falls and costs rise.
Why the Difference Matters for Policy
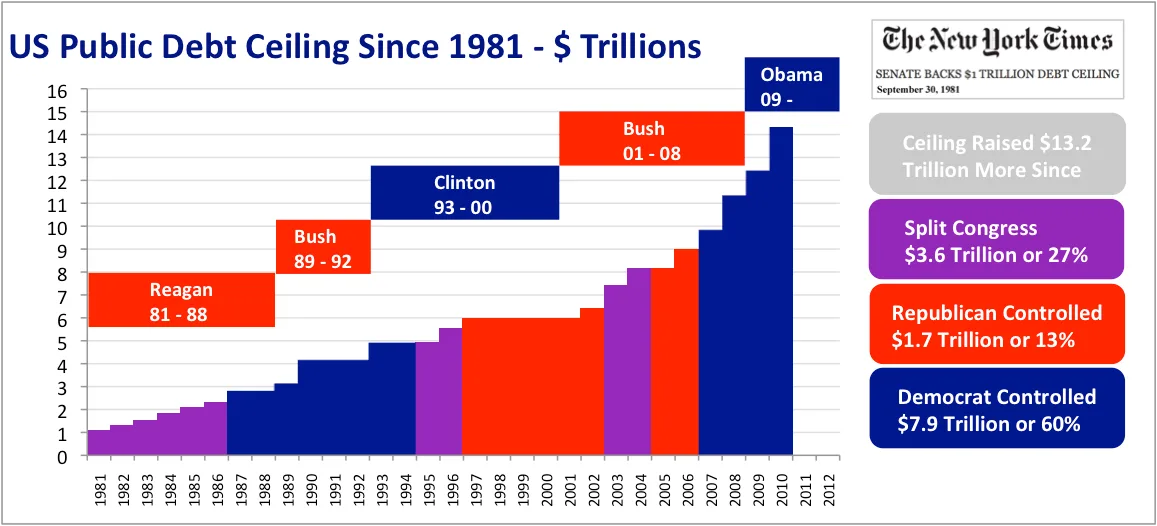
The two terms point to different tools. A deficit debate is about this year's taxes and spending. A debt debate is about the whole stock and whether it is sustainable. Many countries write rules for both: Sweden uses a debt anchor, Germany and Switzerland use a debt brake, and the European Union's Stability and Growth Pact asks members to keep general government gross debt at no more than 60 percent of GDP. Debt ceilings, like the one in the United States, target the stock directly rather than the yearly gap.
Conclusion: Two Numbers, Two Questions
The deficit tells you how fast the water is flowing in this year. The debt tells you how full the tub already is. A country can cut its deficit and still see its debt rise, because a smaller inflow is still an inflow. Reading the two numbers apart makes fiscal news far easier to judge, and it explains why politicians and economists often sound like they are arguing about different things. In a sense, they are. We covered a connected angle in How Earnings Season Works — and What a 10-K Actually Tells You.